Early Thoughts About the Mind
Table of Contents
Man has long wondered about the biological substrate that underlies the mind. The ancient Greeks felt that dissection violated the sanctity of the body, and so they simply speculated about where mind came from. Alcmaeon of Croton correctly surmised that the brain was the seat of the mind, while Aristotle insisted the mind resided in the heart (though the brain was important for cooling the blood).
Early anatomist Galen concluded that the cerebellum controlled the muscles because it was denser, whereas the cerebrum processed the senses, because it was lighter.
Through the Middle Ages and Enlightenment, most exploration of the mind centered around introspection and observation. This resulted in philosophy and the social sciences, and a massive menagerie of reified nouns describing mental constructs that seems to expand at an ever-accelerating rate through the present day.
Modern neuroscience did not really start in earnest until the 1890s, when Golgi invented techniques for staining tissue under a microscope, and the idea of the neuron as the primary atomic unit of the brain was codified. This article does a necessarily abbreviated tour of the neuroscience advances that led to the Neuromythograph.
Brodmann (1907)
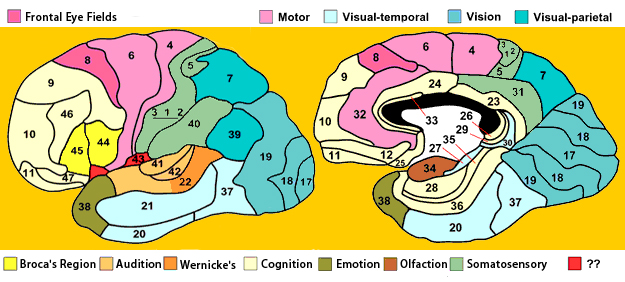
In 1909 Korbinian Brodmann published a 52-sector map of the cortex that is still the most widely-used today. He defined parcels based upon the cytoarchitectonic gradients–changes in the cellular structure–that appeared to divide the cortex into regions when stained and examined under the microscope.
Animal Brain Homologies
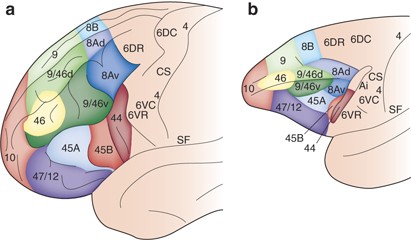
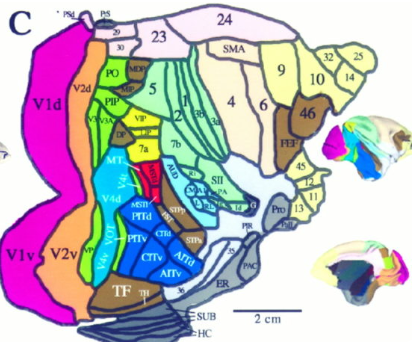
The general topological layout of the brain is conserved across a) humans and b) monkeys (macaques, in the above case). Certain areas have differentially expanded in humans (e.g. area 9/46d) while others have remained relatively conserved (e.g. area 46).
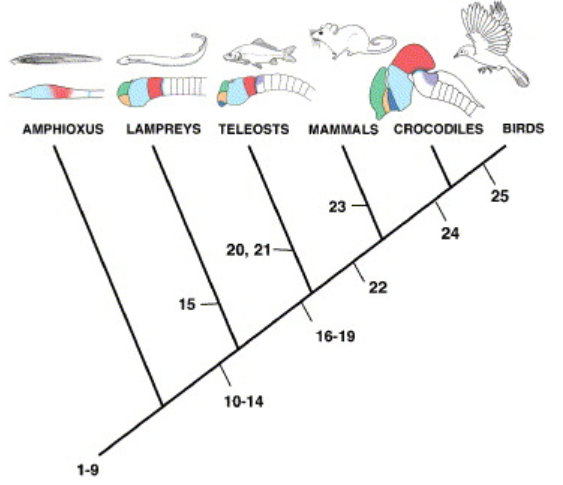
Neuroscientists refer to this as the common bauplan of the brain, which is evidence of evolutionary relationships. More complex lifeforms are elaborations of the patterns established in simpler ones. The richness of evolved forms is inherently embedded in the genetic code handed down from the first creatures. When we find a relationship between body parts between two species, we say that the two parts are homologous.
In the brain, these bauplan-derived topological relationships even hold up back through evolution all the way back to the oldest known living ancestor of vertebrates, the lancelet. The basic brain partitions have retained their homologies throughout evolution.
This allows us to infer a lot about humans by studying animals. While there must always be a cautionary disclaimer that an animal study is not absolutely guaranteed to be applicable to humans, most of the time we can safely make the assumption that human studies will ultimately confirm animal studies.
Surprisingly little unique anatomy or chemistry has found in the human brain to explain our exceptional minds. Even the lamprey has a pallium. We are the product of evolution, we are brothers with our animal kin, and we surely experience the same pains and emotions.
3D fMRI coordinates: Talairach (1988) and MNI (1994)
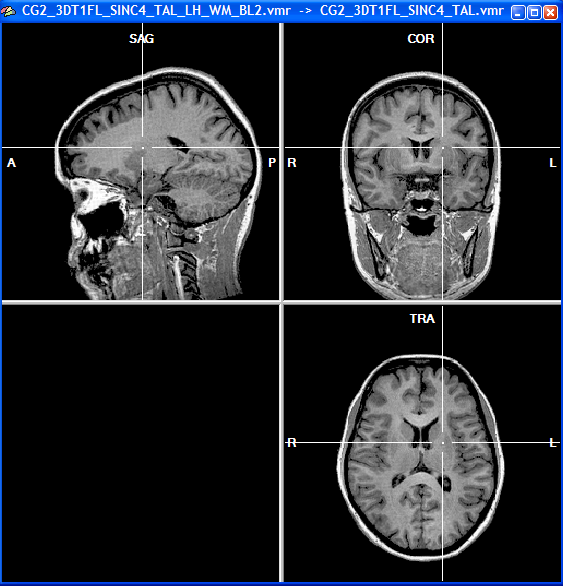
Functional magnetic resonance imaging (fMRI) measures changes in blood flow across areas of the brain, and has been used to non-invasively measure brain activations under different cognitive tasks in humans. Since the advent of fMRI in the early 1990s, thousands of experiments have been conducted to inquire into which brain areas activate under which conditions.
One practical problem in summarizing across studies is that two standardized 3D coordinate systems are commonly used in fMRI research: Talairach and Montreal Neurological Institute (MNI). These coordinate systems can be transformed into each other, but the common use of both systems creates confusion when interpreting fMRI images across studies. Brain structure variation across individuals further degrades the localization of fMRI activations, making it difficult to generalize across individuals using a high resolution map.
These difficulties have been addressed over time via an increasingly sophisticated series of statistical analysis techniques applied to fMRI data. However, the validity of these techniques has often been criticized, most memorably by the dead salmon study.
Most fMRI studies are based on the notion of functional connectivity, which posits that brain areas that tend to fire together statistically can be presumed to be working together in an experimental paradigm. This assumption has been undermined by occasional research, such as an example of “functional connectivity” measured between a surgically-disconnected temporal lobe and distant brain areas.
With these epistemological caveats, I took fMRI studies with a grain of salt, and tried to find at least 2-3 studies across different experiments from which to infer an archetype about any given brain area. I assembled the brain areas in an application called Evernote, and attached key studies to them. Eventually I developed a skill of being able to visually map an fMRI activation to the Brodmann areas (and later, to the Baker surgical atlas based on the HCP parcellation). I went about this every spare moment for five years: during evenings, in between meetings, commuting on the BART, and even while driving I confess.
Eventually, I found it difficult to find generalized archetypal categorizations using the broad anatomical areas commonly used in neuroscience (e.g. thalamus, inferior frontal gyrus, posterior cingulate). These areas are too diverse, and the real exciting differentiation is in the smaller subdivisions. Unfortunately, until recently fMRI was too low resolution to do much more precise imaging than the original 1907 Brodmann areas, even over 100 years later.
Neuronames (1991)
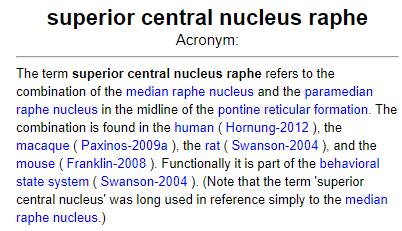
The Neuronames database is a neuroscience nomenclature cross-reference hosted by the University of Washington, St. Louis (perhaps the world’s premiere neuroscience university) was first created in 1991. It is an ontology of neuroscience terms, that helps disambiguate synonyms. For example, the medial raphe nucleus was often referred to in the older literature as the superior central nucleus. Neuronames keeps track of these synonyms and relations in the neuroscience literature. In the Neuromythograph, the most common name is used as the canonical name, and the synonyms are recorded in a separate field. Sorting through this nomenclature redundancy is part of the ground work necessarily to embark upon any neuroscience research study.
The Neuronames database is referenced by many other projects (such as or link to) as an authoritative source. For the Neuromythography, I was more concerned with reconciling what brain areas actually exist than the linguistic problem of reconciling terminology. Where additional terms exist for the same brain area, I chose the one most commonly encountered in the scientific literature as the canonical name, and put others in the synonyms field.
The Flat Brain Map (1997)
In the case of the cortex, most of the gray matter exists in laminated layers at the surface. This lends itself better to a 2D parcel interpretation than the more variable 3D mapping that predominates (due to the neuroscience social norm of using Talairach/MNI coordinates). This flat essentialist view of the cortex has been advocated by David van Essen (University of Washington St. Louis) throughout his career, and led to the key brain atlas discussed later. The 2D point of view facilitates the construction of a navigable map for the Neuromythograph.
The Prosomeric Model (2003)
When early anatomists started partitioning the brain, they started with visually-identifiable structures, such as the cerebrum and the cerebellum. Eventually, they started classifying ares using stains that bind with chemicals expressed by different kinds of cells. Anatomical brain regions came to be named after their discoverers (e.g. diagonal band of Broca), analogous to how much of the New World was named after its explorers. Eventually neuroanatomists exhausted their ability to come up with unique names at all (substantia innominata: unnamed substance, zona incerta: zone of uncertainty, substantia nigra: black substance, locus coeruleus: blue place, nucleus incertus: uncertain nucleus). These placeholder names continue to be used today, in order to provide continuity in the scientific literature.
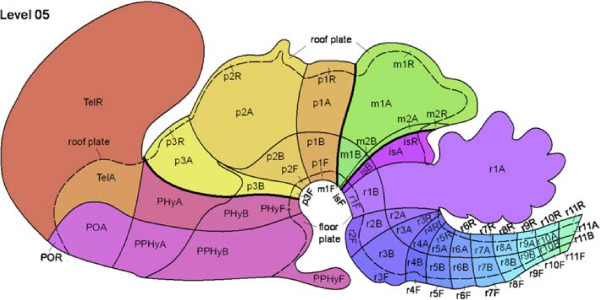
Biology has since determined that development is governed by the expression of a large set of signaling proteins (such as Shh, Gbx2, and Emx1) in unique combinations that define developmental domains. After applying this to the brain, a prosomeric model (Puelles 2003) has emerged that has enhanced the understanding of the invisible structure of the brain beyond its external apperances. This has resulted in some changes versus standard textbooks.
For example, classic textbooks say that the brain has a midbrain and a pons directly behind it, and a medulla at the back. The prosomeric model reveals that the pons is an indistinct entity, and that the isthmus (isA) and r1 are of the same prosomeric origin as the cerebellum, and represent a distinct formation in between the midbrain and the classic pons.
There are two general gradients in the brain: front-to-back and top-to-bottom (anterior-posterior and dorsal-ventral, in biological terms). The Neuromythography uses these prosomeric compartments as primordial domains that group together brain areas that originate within them.
Brain Architecture Management System (BAMS) (2008)
Mihail Bota and his supervisor neuroscience superstar Larry Swanson created a brain ontology called the Brain Architecture Management System (BAMS) during the early 2000s at the University of Southern California. At that time, information technology was in the midst of a hype cycle known as the Semantic Web or Web 2.0, and a great many ontologies were created using technologies such as RDF and OWL. BAMS is a major forerunner to the Neuromythograph.
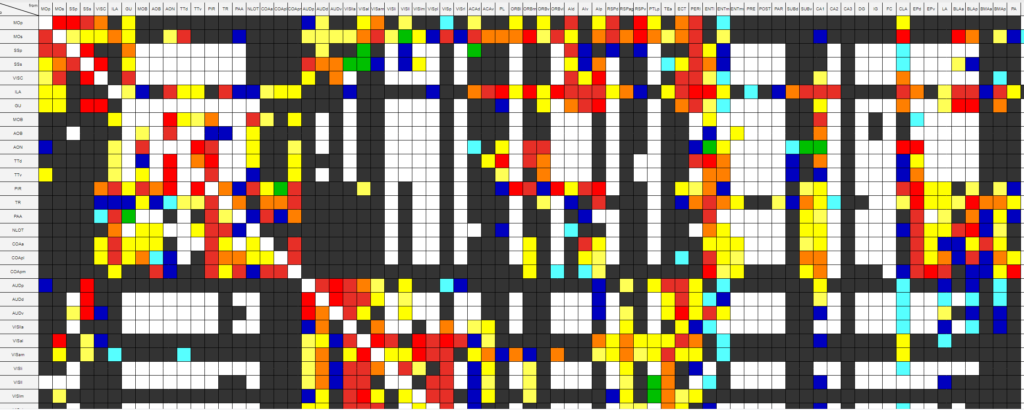
The BAMS team developed text extraction technologies to infer input and output relationships (known as afferent and efferent connections in the neuroscience literature, respectively) between a fairly complete ontology of brain parts. The BAMS ontology identifies 10,000 distinct brain parts, whereas the Neuromythograph only uses about 900 at the time of writing. BAMS, like Neuronames, is heavily concerned with relating the various nomenclatures used by historical researchers to each other, which is a rather unrewarding purpose to the neuromythographer, who seeks to establish a canonical nomenclature and roll any synonyms into it.
The literature database of BAMS includes more than 65,000 studies, considerably more than the manual extraction conducted for the purposes of constructing the Neuromythograph (~30,000). In all candor, I wish I had looked at BAMS before 2020 as it would have saved me time, but in doing the work manually myself I think I absorbed a lot more understanding than I would have than by simply importing data from BAMS. I later used to supplement the Neuromythograph for connections that were hard to come by.
BAMS also overlays neurotransmitters and receptors on top of its database. However, BAMS only has 23 molecules and about 50 receptors in its database. The Neuromythograph has more than 125 molecules and 160 receptors. BAMS molecule data was also incorporated into the Neuromythograph.
Allen Brain Atlas (2010)
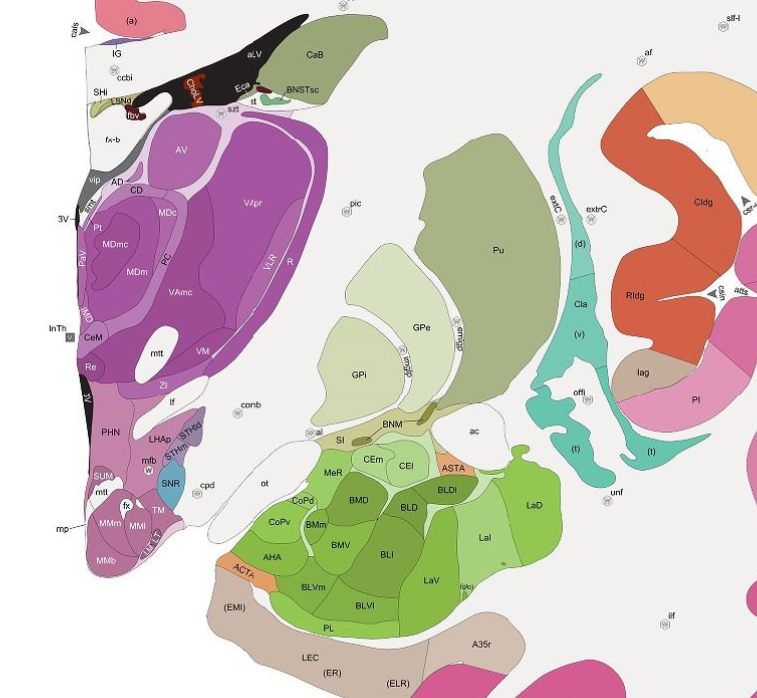
In contrast to the 2D laminar structure of the cortex, subcortical areas are nuclear (meaning that they are irregularly-shaped clusters of neurons rather than laminar layers), These nuclei are intermingled with each other, and during development cells migrate from their birthplaces to distant areas of the brain. This makes the demarcation of strict boundaries problematic. The Allen Brain Institute has published the Allen Brain Atlas references that carefully define the boundaries between brain nuclei. These maps were used to create the subcortical adjacent navigation paths of the Neuromythograph nodes.
The Allen human and mouse brain atlases are not as detailed as exist in the scientific literature for mice and rats. For example, the Allen atlases do not describe the subdivisions of the subthalamic nucleus or the interpeduncular nucleus, that have been fairly well-categorized by the literature. Where the literature describes subdivisions in a functionally-differentiated way, I have created additional child nodes in the Neuromythograph, and differentiated the white matter projections as well.
Neurosynth (2012)
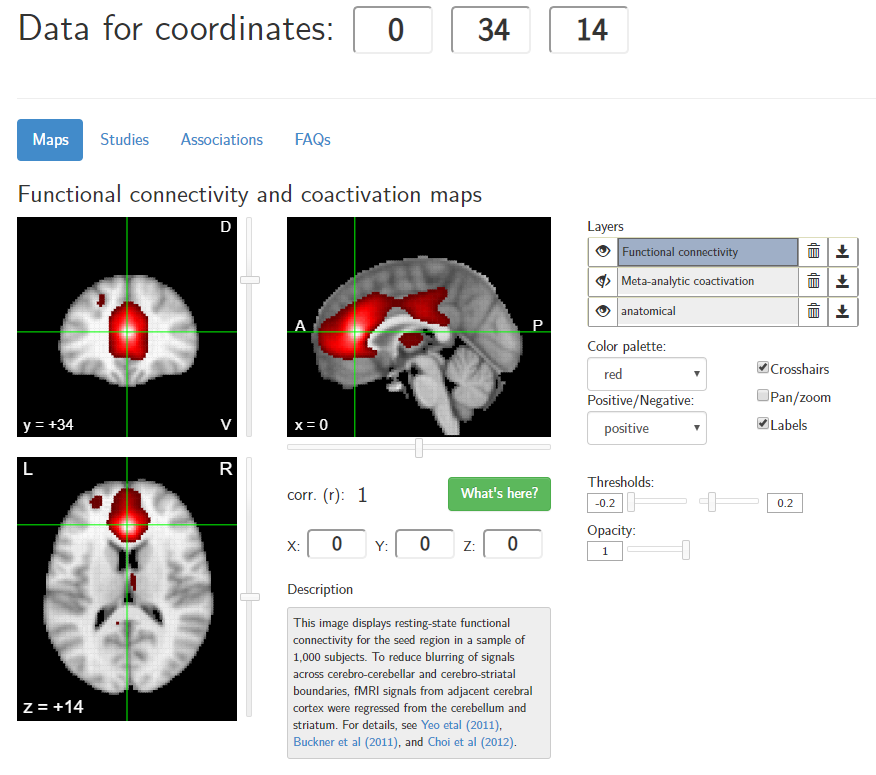
Neurosynth was created in 2012 using automated text analysis pipelines. The Neurosynth database has ingested more than 14,000 studies, extracted the activation fMRI coordinates, and associated each of these activations to a set of concept keywords. This allows one to click on one of the 150,000 voxels in the brain map, and retrieve a set of studies or keywords associated with that pixel. Neurosynth provides a popular resource for researchers to identify literature to include in metastudies of a brain area location.
I myself have found to be Neurosynth useful for my own work. However, I contrast my manual approach with the Neurosynth approach as follows:
- Neurosynth does not attempt to do parcellation, but uses the voxel–a tiny 3D cube within MNI coordinates–as its fundamental unit
- The functional connectivity maps are not as detailed as the HCP-derived maps
- The keyword associations in Neurosynth are often too general to be of much interpretive value (at least for my purposes)
This last issue–interpretive value–is the major focus of my work with the Neuromythograph. The manually-curated Neuromythograph provides a complementary set of knowledge to the automated Neurosynth database.
Human Connectome Project (2012)
The Human Connectome Project (HCP) was a consortium funded by a US NIH grant that conducted a massive fMRI scanning program of over 1,000 individuals for more than sixty minutes each. This created a rich dataset from which to generalize the connectivity architecture of the brain by factoring out individual variation. The HCP dataset is widely used as a starting point for automated brain analysis today. This dataset was too complicated and raw for me to work with directly, but fortunately others created tools that facilitated the Neuromythograph.
A Multi-modal Parcellation (2016)
Glasser et al (2016), a team working in David van Essen’s University of Washington St. Louis lab, created a definitive parcellation of the human brain using Human Connectome Project fMRI data. They conducted a painstaking multimodal (i.e. multiple method) analysis across the HCP dataset. This map is a breakthrough in that it is a surface map that can be effectively overlayed upon any individual’s fMRI brain scan. The ‘individual mosaic tiles’ may be shaped differently across individuals, but the relative topological relationships between the areas are consistent. This has made it a popular reference map applied in post-processing for many neuroscience studies since 2016. The Neuromythograph anticipates a future in which most fMRI studies are run through the Glasser post-processing pipeline, and neuromythography descriptors can be appended to the parcellation results to provide greater interpretive value.
Functional Domains
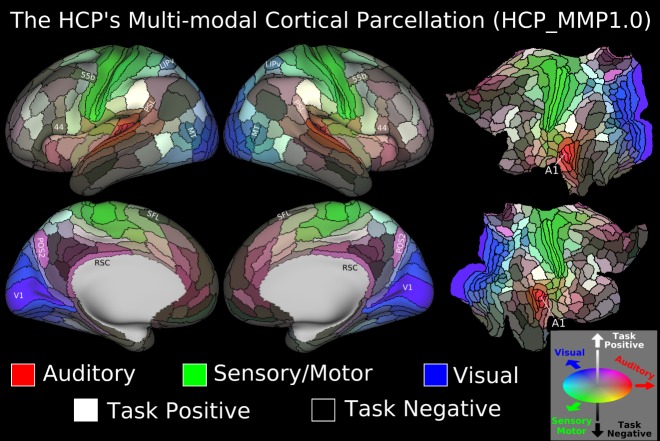
The HCP data collection methodology included having participants execute a number of cognitive tasks while performing the brain scans. The Glasser team used this information, along with an investigation of the prior literature involving each parcel, to speculate about the functions of the brain area. There are a number of known networks in the cerebral cortex, and the above map reflects the network assignments for each area of the new parcellation. The Task Positive network is activated when engaged in externally-focused tasks, while the Task Negative network is activated upon introspection and inactivity.
Nomenclature Reconciliation

Glasser, van Essen et al created a hybrid map that attempted to preserve brain area names commonly used in the macaque literature for clarity, while coining some new names for new areas. This resulted in a cortical map containing 180 areas, replicated in each hemisphere. The Neuromythograph uses this as a baseline for the cortex, but subdivides some of these into child areas based on other research.
Inflated Brains vs. fMRI coordinates
The inflated brain model is very convenient, but it introduces severe distortions versus the actual wrinkled surface of the brain. This is analogous to how the Mercator projection distorts maps of the earth. This makes it difficult to interpolate between an fMRI scan and the general map.
A Connectomic Atlas of the Human Cerebrum (2018)
In 2018, a group of neurosurgeons at the University of Oklahoma (Baker et al (2018)) tackled this problem and published A Connectomic Atlas of the Human Cerebrum. As these were working neurosurgeons rather than researchers, they wanted to take advantage of the detailed Glasser / van Essen parcellation to inform surgical practices. As they note in their introduction,
While neurosurgeons can typically predict and preserve primary cortical function through the primary visual and motor cortices, preservation of higher cognitive functions that are less well localized in regions previously deemed “silent” has proven more difficult. […] Newly published parcellated cortex maps provide one avenue to study such connectomics in greater detail, and they provide a superior framework and nomenclature for studying cerebral function and anatomy.
A Connectomic Atlas of the Human Cerebrum, Chapter 1
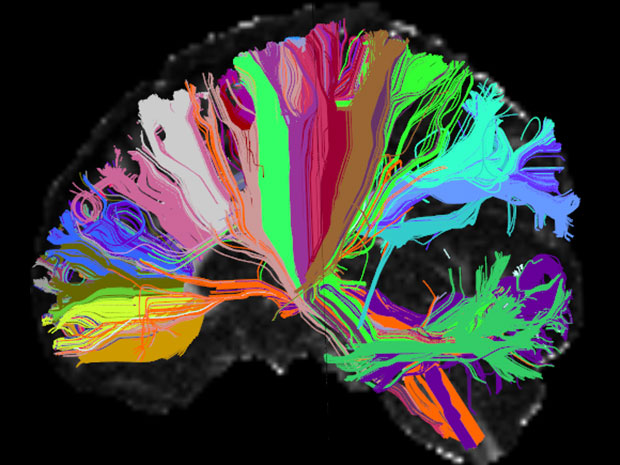
A Connectomic Atlas published a long-distance wiring diagram for the Glasser parcellation, by analyzing major white matter tracts. These connections were catalogued as entrances and exits within the Neuromythograph.
A Connectomic Atlas analyzed each parcel of the Glasser parcellation, identified functional connectivity partners (brain areas that tend to activate together with the target area), and physical white matter connections to other areas. This informed hypotheses about how the ‘characters’ in the brain interact.
Crucially, A Connectomic Atlas mapped the inflated brain parcels to a real cadaver brain, showing the neurosurgeon the approximate real anatomical location of the parcel. This map is what I have used to map fMRI to the Glasser parcellation, as I have trained my eye to map an fMRI image activation back to this neurosurgical reference map over the past few years. Intrepid neuromythographers must also learn this skill.
Rat Flatmap 5.0 (2020)

Larry Swanson, a neuroscientist at the University of Southern California, is (amongst other accomplishments) perhaps the world’s foremost creator of flatmap projections of the brain that project 3D brain topological relationships onto a 2D surface. His work inspired and informed the topographic relationships portrayed in flat visualizations of the Neuromythograph. I was particularly inspired by his approach to connecting the basal forebrain, prethalamus, and hypothalamus to the pallium in two dimensions, a problem that vexxed me for a long time. I used Swanson’s rat brain flatmap more than the human or mouse ones because it contains the most nuclear detail (because much of Swanson’s career has focused on the rat), and the (fairly reliable) assumption that the topographic relationships are conserved.
Neuromythograph
The Neuromythograph is:
- a hand-curated database of more than 925 brain areas, constituting ‘golden records’ extracted from tens of thousands of neuroscience studies across humans and animals
- more than 19,000 entrances, exits, parent-child, functional connectivity, and thalamic relationships, comparable in size to the automated BAMS database but manually-constructed
- more than 280 neurotransmitters and receptors, and their expression in different brain areas
- a prosomeric embryological zone model used for grouping brain areas into more than 100 primordial domains, primarily influenced by the Puelles prosomeric model
- a novel model of how the brain interacts with the ectoderm, endoderm, and mesoderm layers of the body, and the internal organs and senses.
- a concept ontology connecting the neuroscience to real-world concepts
- Most importantly, archetypal interpretations of the biological entities, with these personifications representing theories about their role in the “society of mind”
The Neuromythograph is derived from the following sources:
- the Human Connectome Project dataset, parcellated by Glasser et al (2016), converted into a surgical atlas by Baker et al (2018)
- the Allen Brain Atlas of the adult human brain (primarily subcortical areas)
- the prosomeric embryological brain model (Puelles 2009)
- the Swanson brain flatmap (2020)
- the Brain Architecture Management System (BAMS) (Bota/Swanson 2002)
- world mythology, religion, history, famous persons, and scientific pioneers
- a manual review of tens of thousands of neuroscience and psychology studies, extracting afferent & efferent projections, subdivisions, neuromeric domains, receptors, and neurotransmitter, and entering them into the database.
To Publish or Perish
I am currently writing several academic papers for publication, and am writing a book based on the Neuromythograph. The complexity of the information I have assembled does not lend itself well to the linear progression of the book medium. The chaotic beauty of a hyperlinked web of pages better suits the ideas I am communicating, and for self-exploration by others.
Methods
The age of the Internet is the age of the autodidact. My neuroscience education has been entirely self-taught thanks to the ready availability of research information on the Internet. To conduct research, I initially used Evernote starting in 2015 to lay out notes on each of the various anatomical and biochemical entities. After trying to find a graph database application stack that would suit my purposes, I settled on Airtable as a flexible zero-coding graph database. I connected Evernote to the Airtable via the Integromat integration service. The personal research pipeline of Google Scholar and other online resources, capturing web pages into Evernote, and connecting each study in Airtable to its Neuromythograph metadata has enabled me to rapidly sift through the neuroscience literature over the past few years for the purposes of constructing the database.
I am not alone in attempting to scale this mountain. There are many intrepid seekers, from those who coin neologisms like neurophilosophy, neuropsychology, and neuroeconomics, and assert expertise in them; to computer programming savants building sentient AIs; to mystic/theorists like Wai S. Tsang whose esoteric fractal brain theory inspired some ideas of my own. I hope that I have built something permanent.
Study hard what interests you the most in the most undisciplined, irreverent and original manner possible.
My purpose is not scholarship for its own sake, but my own understanding, ontology construction, and ultimately archetypal interpretation. I sought to review as many studies as I could at high throughput in order to assess whether a proposed archetypal assignment made aesthetic sense in light of the literature. As I was not trying to master a prescribed curriculum,, I sought to absorb as much interesting information as possible in order to extract the “essences”.
In summary, I evolved my own independent methods through trial and error, because I was doing something no one has been able to do before the existence of the Human Connectome Project and its successors. I let my intuition guide me, and the resulting understanding is pleasing to me aesthetically. My work stands on the shoulders of giants; hopefully it bears fruit in the hands of future generations.